Why do we disaggregate data and how can it help people?
Date: Nov 19th 2025
First, why is this such an important topic today?
Even though funding for inclusive health services is critically low worldwide, funding for disability rights is falling aggressively. One critical factor in remedying this is data. Data on disability prevalence, on barriers to inclusion, on disability support needs. The more people know how serious a problem is, the more it can be treated seriously. And that is where disability-disaggregated data comes in.
Disability-disaggregated data acts as a compass for insightful policy making and uncovers the unseen, illuminating those left in the shadows. This critical information reveals unique challenges and paves the way forward. It is necessary to keep track of the Sustainable Development Goals (SDGs) and the United Nations Convention on the Rights of Persons with Disabilities (CRPD). Moreover, Disability-disaggregated data helps shape national and subnational policies, ensuring that such policies overlook no one.
But the Global Disability Summit’s Global Disability Inclusion Report states “there is a lack of systematic analysis of existing data and disaggregation of standard policy indicators.” Simply put, global disability-disaggregated data is badly needed right now, and it is why we created the Disability Data Initiative (DDI).
But what is disaggregated data?
Disaggregation is when you take a group’s data, say on employment status, and divide it into smaller parts. For example, you might separate employment status for young adults from middle-aged adults.
Why is this necessary? Because when data is aggregated for an entire population, they can hide differences between groups. If data covers a group that is too large, its sub-groups that suffer disproportionately will get overlooked. So, disaggregation aims to compare smaller groups. This helps spot differences or gaps based on age, gender, location, migrant status or disability.
Disability-disaggregated data (or statistics) are data broken down by disability status, severity or type. Researchers use such data to examine and compare different groups.
Take employment for instance. If we see a country has a high employment rate, we may think that most population groups are doing well there. But if we disaggregate the data and show the employment rate for people with disabilities and those without, we may see that one group is struggling disproportionately. Researchers can also divide data by other factors like age, gender, and where people live. We can compare young adults with disabilities to young adults without disabilities. We can also look at middle-aged adults in the same way.
How is disability-disaggregated data compiled?
National statistics are typically compiled from data collected through household surveys and population and housing censuses where people are asked questions about their own situations and of their families.
There are various ways to ask questions about disabilities in surveys and censuses. To produce disability-disaggregated data that can be compared across countries, the Washington Group on Disability Statistics (WG) developed question sets that have been designed and tested to be comparable across countries. The WG Short Set of questions on disability can easily be incorporated into censuses and surveys with only six questions on difficulties seeing, hearing, walking, remembering/concentrating, self-care and communication.
The Disability Data Initiative
The DDI has documented the availability of surveys and censuses that include the WG Short set or similar questions in its Disability Statistics – Questionnaire Review (DS-QR) Database.
With surveys and censuses that have such questions, the DDI has for the first time developed methods and used them to produce disability-disaggregated statistics for adults in countries around the world. They are available in the Disability Statistics – Estimates (DS-E) Database. About 30 indicators are disaggregated by disability status overall, by type of disability, by severity, for all adults and then by subgroup (men, women, rural/urban residents, ages 15 to 29, 30 to 44, 45 to 64, 65+). The DDI’s methods and estimates have been used by a variety of stakeholders, such as the World Bank in the Disability Data Hub.
What the DDI discovered warrants a sense of urgency
DDI’s disability-disaggregated statistics show consistent inequalities between persons with and without disabilities in various dimensions of wellbeing (education, personal activities, health, standard of living, poverty).
For instance, the graph below shows for selected countries in the East Asia and Pacific region, the multidimensional poverty rate by disability status, with significantly higher rates among persons with disabilities than among persons without disabilities.
Figure 1: Multidimensional poverty rates for selected countries in East Asia/Pacific by disability status (No disability, Disability)
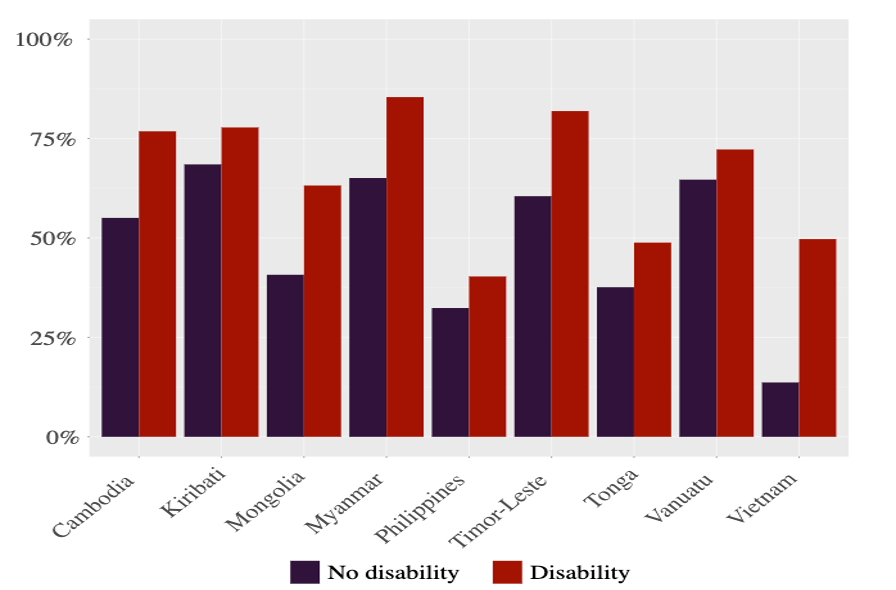
Source: DDI (2024). Disability Statistics – Estimates Database (DS-E Database). Disability Data Initiative collective. Fordham University: New York, USA. https://ds-e.disabilitydatainitiative.org/DS-E/
Suggested citation:Disability Data Initiative (DDI). (2025). Why we disaggregated data and how it can help people? Nov. 19th 2025. Accessed at https://www.disabilitydatainitiative.org/blogs/
Disability-disaggregated data like this are key to inform advocacy, policy and research and to make persons with disabilities visible in cross-country and national statistics.