How many youths lack both school and work? Is it worse for youths with disabilities? Data can tell us
Date: Dec 3rd 2025
Overview
Imagine how different your life would be if you could not go to school or start working during the most important years of growing up. How many fewer choices would you have today?
This is the reality for many young people around the world. In fact, one in four young people are not in school or working, according to the International Labour Organization. This can cause serious problems for their future as they lose chances to learn, make a living, and be part of their community.
Most people would recognize this as a huge problem. But our question is: how much worse is it for young people with disabilities?
And we are not asking just for the sake of asking. The first step to solving a problem is to understand it. That is where our database helps:
The Disability Data Initiative (DDI) created the Disability Statistics – Estimates (DS-E) database, analysing data for many low- and middle-income countries.
Here, “youth” means people ages 15 to 24 and “Idle rate” means the share of young people who are not in school and not working.
About the DS-E Database
The DS-E database measures many inequalities that people with disabilities have to face. It does this by using data from population censuses and household surveys from around the world.
Here, we can use the database to find out how many young people with or without disabilities grow up without options for school or work. We can also look at differences between young men and women, and between youth living in cities or rural areas.
The database helps us understand:
- How many young people with and without disabilities are not in school or working
- How results differ for boys and girls
- How results differ for youth in cities and rural areas
A young person is counted as “working” if they:
- Work for pay
- Run their own small business or work for themselves
- Help in a family business or farm, even without pay
The DS-E database has statistics for countries that used the Washington Group Short Set of disability questions or similar disability questions. In this example, the youth idle rate is disaggregated by disability status and by severity level. It is also available separately for men or women and for rural or urban residents.
Youth Idleness by Disability Status
So now that we can look at the youth idle rate for those with disabilities specifically, we discover that the results can be bleak.
Figure 1 shows youth idle rates in 31 countries. It shows that young people with disabilities are much more likely to be out of school and out of work. For example, in Bangladesh, more than half (53.4%) of youths with disabilities are not in school and not employed, compared to 37.5% of youths without disabilities.
Figure 1: Youth Idle Rate by Disability Status
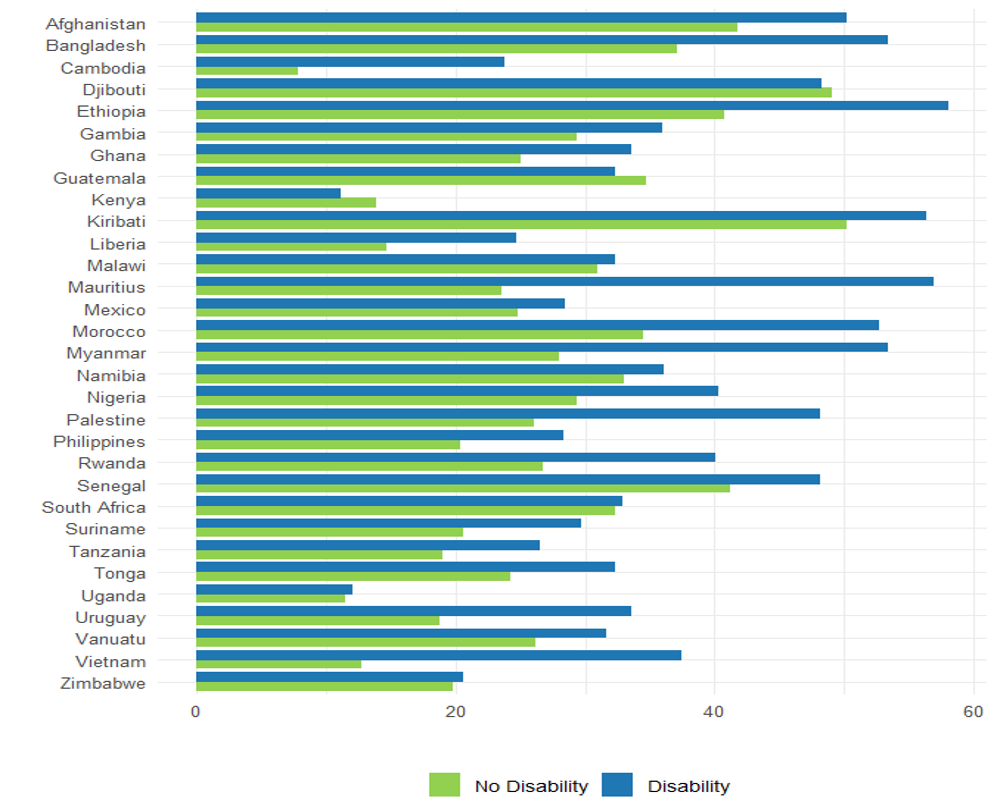
In most countries, youth with disabilities are more likely to be neither in school nor employed.
Source: DDI (2024). Disability Statistics – Estimates Database (DS-E Database). Disability Data Initiative collective. Fordham University: New York, USA. https://ds-e.disabilitydatainitiative.org/DS-E/
Differences by Disability Severity
Some countries in Figure 1, such as Djibouti, Kenya, South Africa, Uganda, and Zimbabwe, show no gap between youth with and without disabilities. At first, this may seem less bad for youths with disabilities. But when we disaggregate the data, we can understand that it is not that simple.
To understand this better, Figure 2 looks at youth idle rates by how severe the disability is. It compares three groups:
- Youth with No Disability (no difficulty)
- Youth with Moderate Disability (some difficulty)
- Youth with Severe Disability (a lot of difficulty or cannot do certain tasks at all)
The more severe the disability, the more likely a young person is to be out of school and out of work.
The data shows that:
- One in four youth without disabilities are not in school or working.
- One in three youth with moderate disabilities are not in school or working.
- One in two youth with severe disabilities are not in school or working.
Kenya is an exception. In Kenya, the idle rates for youth with and without disabilities are almost the same. This may be because more youth with disabilities in Kenya work informally, including for themselves.
Overall, these findings are similar to results from high-income countries using data from the Organisation for Economic Co-operation and Development (OECD). They also match UNICEF’s evidence that children with disabilities are more likely to drop out of school. This shows that youth with disabilities face real barriers when moving from school to work.
Figure 2: Youth Idle Rate by Disability Severity
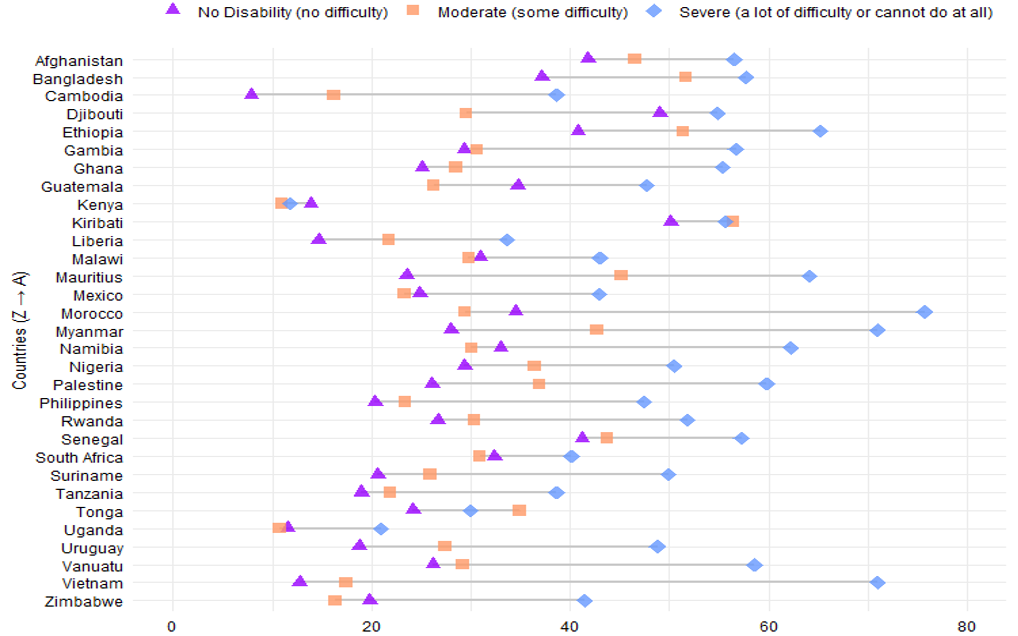
Source: DDI (2024). Disability Statistics – Estimates Database (DS-E Database). Disability Data Initiative collective. Fordham University: New York, USA.https://ds-e.disabilitydatainitiative.org/DS-E/
What do we do with this data now?
More research on youth idleness is now possible because there is better disability data available. But as we stated before, making data like this available is also the first step in improving things for these youths.
It makes the case for stronger policies, to make sure youth with disabilities have equal access to education and jobs. And having this data makes it easier to advocate on behalf of these youths with disabilities.
Suggested citation: Disability Data Initiative (DDI). (2025). How many youths lack both school and work? Is it worse for youths with disabilities? Data can tell us. Accessed at https://www.disabilitydatainitiative.org/publications/DDIblog2025-02