Nigeria
 Go Back
 Results in this brief are from an analysis of the 2018 Demographic and Health Survey. Information on methodology is in the main text of the report and in the method briefs. Additional results are available in results tables on the DDI website.
Share of Adults with Functional Difficulties
In Nigeria, the share of adults aged 15 and older with any functional difficulty stands at 11.4%. As shown in Table 1, it varies from a low of 7.5% in North West to a high of 17.1% in South South. In all regions, seeing is the most common type of functional difficulty.
Table 1: Nigeria: Share of Adults with functional difficulties at the regional level (%)
| Region | Any | Seeing | Hearing | Mobility | Cognition | Self-Care | Communication |
|---|---|---|---|---|---|---|---|
| North Central | 10.5 | 7.4 | 1.6 | 3.1 | 1.7 | 1.9 | 1.4 |
| North East | 11.3 | 7.7 | 3.0 | 3.1 | 1.4 | 1.3 | 1.7 |
| North West | 7.5 | 4.0 | 1.7 | 3.1 | 0.9 | 1.7 | 1.0 |
| South East | 16.7 | 14.1 | 1.6 | 4.4 | 1.7 | 2.6 | 1.2 |
| South South | 17.1 | 13.6 | 2.1 | 5.2 | 1.9 | 2.5 | 1.6 |
| South West | 11.2 | 8.6 | 0.6 | 2.9 | 0.6 | 1.7 | 0.8 |
| National | 11.4 | 8.2 | 1.7 | 3.5 | 1.2 | 1.9 | 1.2 |
Notes: ‘Any’ is the share of adults with any level of difficulty (some difficulty, a lot of difficulty or unable to do in one or more functional domains. For instance, ‘Seeing’ is the share of adults with difficulty in seeing of any level. Shares for the six domains do not add up to the share of any difficulty as some individuals may have functional difficulties in more than one domain. Source: Own calculations based on Nigeria DHS data.
Multidimensional Poverty
Multidimensional poverty captures an individual’s experience of multiple deprivations (e.g. low educational attainment, having inadequate living conditions). In Nigeria, the shares of persons with at least a lot of functional difficulty who are multidimensionally poor stands at 81.3%. This is higher than those of persons with some difficulty and no difficulty, which are at 56.2% and 56%, respectively.
Thus, there is a disability gap in multidimensional poverty between persons with at least a lot of difficulty and some or no difficulty (about 25 percentage points). In other words, persons in Nigeria with at least a lot of functional difficulty more frequently experience multiple deprivations than those with some or no difficulties.
As illustrated in Figure 1/Table 2, multidimensional poverty is common in all regions among adults with functional difficulties. South West has the lowest multidimensional poverty headcount across adults with and without difficulties.
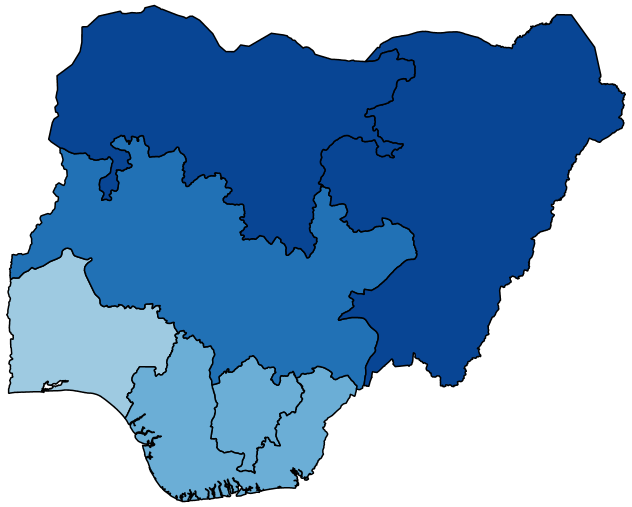
Figure 1: Nigeria: Multidimensional poverty headcount among adults with no, some and at least a lot of difficulty (%)
Figure1a: Adults with no difficulty
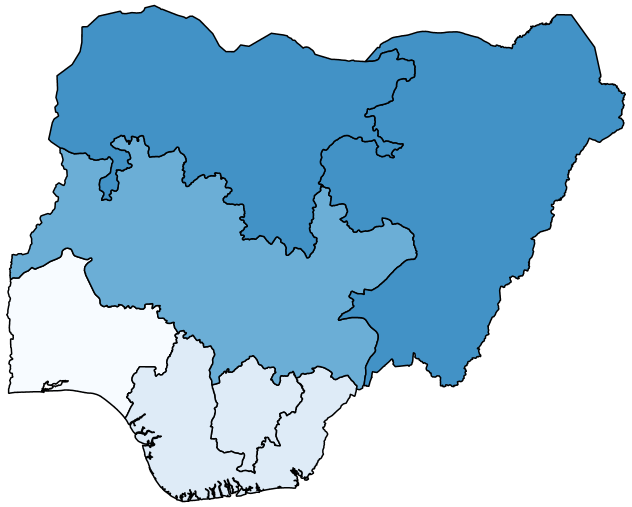
Figure 1b: Adults with some difficulty
Figure 1c: Adults with at least a lot of difficulty
Source: Own calculations based on Nigeria DHS data (2018). The notes of Table 1 apply.
Table 2 (Supporting Figure 1): Nigeria: Multidimensional poverty headcount among adults with no, some and at least a lot of difficulty (%)
| Region | No difficulty | Some difficulty | At least a lot of difficulty |
|---|---|---|---|
| North Central | 60.7 | 66.0 | 87.6 |
| North East | 78.8 | 83.4 | 96.1 |
| North West | 74.3 | 80.4 | 93.1 |
| South East | 38.7 | 42.7 | 64.9 |
| South South | 34.6 | 48.2 | 69.9 |
| South West | 25.9 | 26.5 | 54.6 |
| National | 56.0 | 56.2 | 81.3 |