The Disability Statistics – Estimates (DS-E) database shows the inequalities persons with disabilities face
Kaviyarasan Patchaiappan
Date: May 14th 2026
Imagine trying to understand the lives of persons with disabilities. Now try to understand the inequalities they face across many different countries.
You need disability-disaggregated statistics (or data) to make their situation visible. Disaggregation is when you take a group’s data, say on employment status, and divide it into smaller parts. For example, for adults with and without disabilities.
Yet, such statistics are often not available. That’s why the Disability Data Initiative (DDI) created the Disability Statistics – Estimates Database (DS-E database) (DDI 2025a).
The DS-E database is based on population census or household survey data that have internationally comparable disability questions. These could be the Washington Group Short Set of questions (WG-SS) (or similar questions). They are now used in many countries (DDI 2025b), as shown in our other blog.
The DDI team analyse the data and share their findings in the DS-E database.
The DS-E database is like a big global library. It has statistics for many countries in one place. It does more than count how many persons have disabilities. It tells a deeper story — how persons with disabilities live their current lives.
For example, it shows if adults with disabilities have completed primary education. It also shows if adults with disabilities have a job. It helps us see the current struggles of persons with disabilities. It looks at many parts of life, not only disability itself. It gives results for education, health, work, living conditions, and poverty.
In addition to showing national-level results, it also lets us see differences within countries. This is important because some places may have bigger challenges than others.
We have a guide on how to use the database in its interactive or downloadable format.
The DS-E database first launched in 2024. At that time, it shared results for 40 countries and 29 indicators, such as education and poverty. We highlight below some of its new enhancements.
What’s New?
New Countries
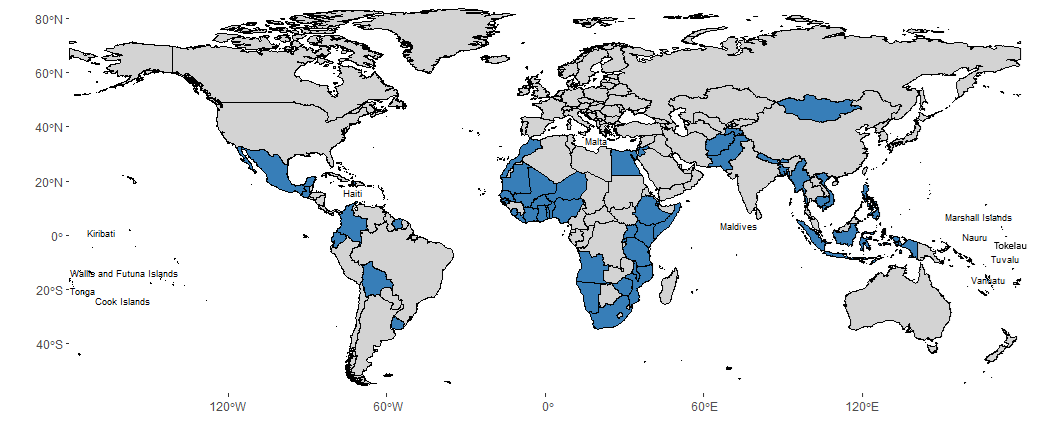
The DS-E database has expanded in the 2025 edition. It now covers 25 additional countries, giving a more complete picture of disability inequalities across world regions.
The newly added countries are Angola, Benin, Bhutan, Bolivia, Burkina Faso, Colombia, Congo Rep., Cook Islands, Côte d’Ivoire, Ecuador, Egypt, Guinea-Bissau, Indonesia, Jordan, Malta, Marshall Islands, Mozambique, Nauru, Niger, Sierra Leone, Somalia, Togo, Tokelau, Tuvalu, and Wallis and Futuna.
Figure 1: Country coverage of the DS-E database, with included countries in blue.
New Indicators
The 2025 edition added six new indicators on demographics and health: adults who live alone, households with a recent death, child mortality, problems accessing healthcare, Body Mass Index (BMI), overweight or obese. These new indicators help us better understand how persons live. And the health differences between groups.
For example, adults with disabilities are more likely to live alone than adults without disabilities. And women with disabilities more often report problems accessing health care compared to women without disabilities.
New Disability Breakdowns and Groups
Disability is not the same for everyone. Persons with different levels of difficulty, or different types of difficulty, may face different inequalities. It is possible to disaggregate, or break down, the data differently based on severity and type.
In the 2025 edition of the DS-E, we provide more ways to break down the data. In particular, we now provide statistics for each level of severity across four groups: No difficulty — Some difficulty — A lot of difficulty — Cannot do.
We also provide breakdowns for different levels of severity for each disability type. For example, for vision, it is now possible to compare outcomes such as poverty between persons who cannot see at all, persons who have a lot of difficulty seeing, persons with some difficulty seeing, and persons with no difficulty.
New Interactive Features
Finally, we revamped the interactive platform for enhanced accessibility and speed.
Overall, the DS-E database is the most comprehensive source of disability-disaggregated statistics across countries. Its recent enhancements help measure the inequalities faced by persons with disabilities around the world. To inform advocacy, policy, and research.
Your feedback is very welcome at disabilitydatainitiative.help@gmail.com
References
DDI (2025a). Disability Statistics – Estimates Database (DS-E Database). Disability Data Initiative collective. Fordham University: New York, USA.
DDI (2025b). Disability Statistics – Questionnaire Review Database (DS-QR Database). Disability Data Initiative collective. Fordham University: New York, USA.
Suggested citation: Patchaiappan, K. (2026). The Disability Statistics – Estimates (DS-E) Database shows the inequalities persons with disabilities face. Disability Data Initiative (DDI). May 14th 2026. Accessed at https://www.disabilitydatainitiative.org/blogs/ns/DDIblog2026-02