The Disability Statistics – Estimates (DS-E) Database Helps Identify Intersectional Inequalities
Haritha Boopalan, Sophie Mitra
Date: August 27th 2026
Introduction
The idea of intersectionality was introduced by legal scholar Kimberlé Crenshaw. In 1989, she explained that African American women in the United States could experience discrimination that was not fully understood by looking at race or gender separately. Their experiences were shaped by the interaction between race and gender (Crenshaw, 1989).
Why intersectionality matters
A recent Open Data Watch report (2025) on intersectional data and persons with disabilities highlights that, despite their importance, intersectional disability data are still limited in many countries. The report calls for data that reflect the diversity within disability communities, including by disability type, age, sex, location and other characteristics, and for stronger partnerships between disability communities, national statistical offices and other stakeholders.
The Disability Statistics – Estimates database, or the DS-E database, is one step toward meeting this need. It currently allows users to examine disability together with one other characteristic: sex, age, or urban or rural residence. This is an initial step toward building a more complete picture of inequality.
Inequalities do not simply add together. They interact with one another.
For example, a woman with a disability may experience barriers that are shaped by both disability and sex. These barriers are not always two separate disadvantages. They can be connected and can affect access to healthcare, employment, education, and social protection.
The DS-E database currently allows users to examine disability together with one other characteristic: sex, age, or urban or rural residence. This is an initial step toward building a more complete picture of inequality.
How to use the DS-E for an intersectional approach
1. Available intersecting axes
The DS-E database offers estimates for 35 indicators on prevalence, education, personal activities, health, standard of living, insecurity, and multidimensional poverty for three intersections:
- Disability and sex.
- Disability and age (15 to 29, 30 to 44, 45 to 64, 65 and older).
- Disability and urban/rural residence.
People with disabilities have different experiences. The database can therefore measure disability as an overall status or provide more detail by severity or type of disability. The earlier post on the 2025 DS-E update explains these measures in more detail.
2. Choose your intersecting axes
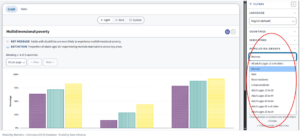
First, decide which comparison you want to explore. For example, you may want to study multidimensional poverty by disability status and sex.
In the database, select “women” under population groups. You can then compare multidimensional poverty among women with disabilities and women without disabilities. Repeat the process by selecting “men” to compare the results for men.
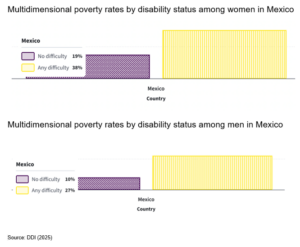
The charts below show multidimensional poverty rates in Mexico for women and men by disability status.
Multidimensional poverty means experiencing more than one type of deprivation. For example, a person may face difficulties related to education, healthcare, housing, income, or living conditions.
Among women in Mexico, multidimensional poverty affects 38 percent of women with disabilities and 19 percent of women without disabilities. Among men, it affects 27 percent of men with disabilities and 10 percent of men without disabilities.
To examine the combined disadvantage associated with sex and disability, we can compare men without disabilities with women with disabilities. The difference is 28 percentage points: 38% minus 10%.
3. Identify the largest gaps
You can use the database to find the largest differences between people with and without disabilities, both within a country and across countries.
You can also compare different groups of people with disabilities. For example, you can compare:
- Women with disabilities and men with disabilities.
- People with disabilities living in rural areas and people with disabilities living in urban areas.
- Women with disabilities and men without disabilities.
These comparisons can help identify groups that may face the greatest disadvantages.
You can explore the interactive database or download the data for further analysis.
Limitations
The DS-E currently compares disability with only one other characteristic at a time. It cannot yet examine three characteristics together.
For example, the database cannot currently provide estimates for older women with disabilities by combining disability, sex, and age. We hope to add more detailed comparisons in future versions, if the available samples are large enough to produce reliable estimates.
The database measures disability together with sex, rather than gender, across its 65 countries. As a result, it cannot currently provide separate estimates for non-binary adults by disability status. This limitation reflects the way sex and gender information was collected in the surveys used by the database.
Explore it yourself
Explore these intersections directly in the interactive DS-E database or download the full dataset there. If you have questions or suggestions for this series, contact the DDI team at DisabilityDataInitiative.Help@gmail.com.
References
Crenshaw, K. (1989). Demarginalizing the intersection of race and sex: A Black feminist critique of antidiscrimination doctrine, feminist theory and antiracist politics. University of Chicago Legal Forum, 1989(1), 139–167.
Disability Data Initiative. (2025). Disability Statistics – Estimates Database (DS-E Database). Fordham University.
Open Data Watch. (2025, September). Intersectional data and persons with disabilities.
Patchaiappan, K. (2026, May 14). The Disability Statistics – Estimates (DS-E) Database shows the inequalities persons with disabilities face. Disability Data Initiative.
Suggested citation for this blog:
Disability Data Initiative (DDI). (2026). The Disability Statistics – Estimates (DS-E) Database Helps Identify Intersectional Inequalities. Boopalan, H., & Mitra, S. Accessed at https://www.disabilitydatainitiative.org/the-disability-statistics-estimates-ds-e-database-helps-identify-intersectional-inequalities/